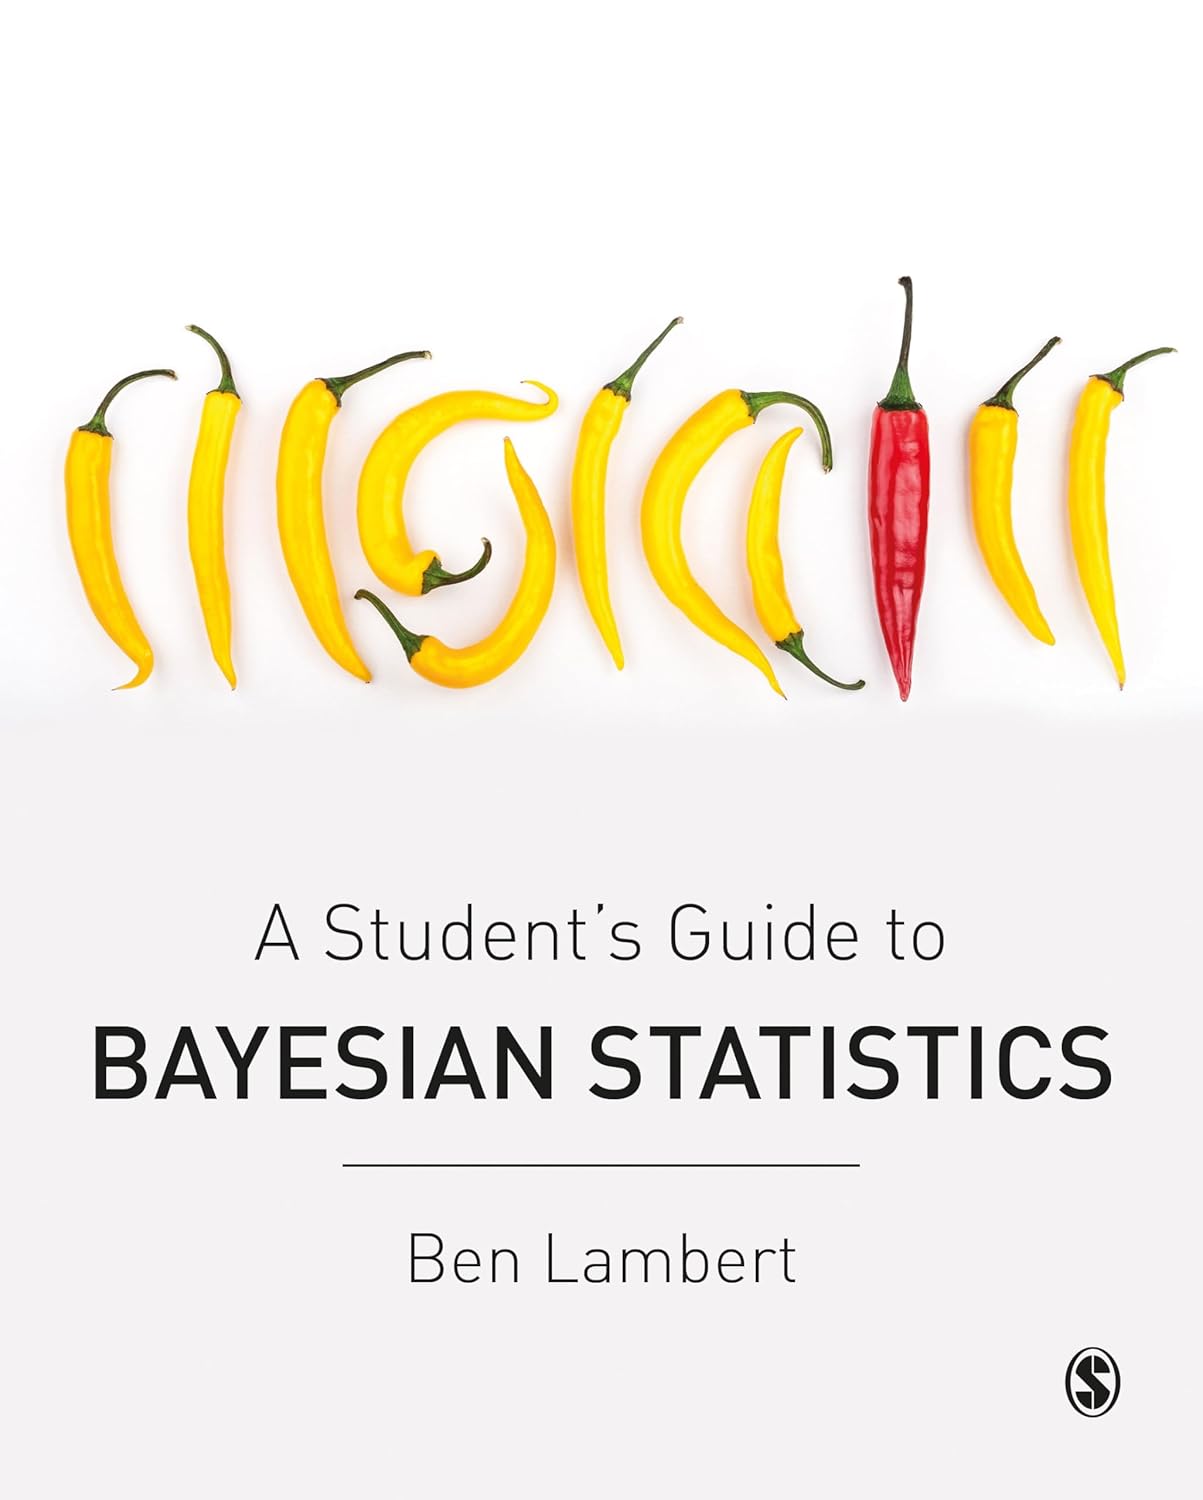
 A question on X validated led me to this Bayesian book with a chill cover (except that it first made me seek a word from the chili sequence!), because of a graph within that confused the OP for that question. Here is the graph:
 It represents three *prior* densities at once, namely the (uniform) prior density of a Binomial probability θ, the prior density of its transform θ², and the prior density of the other transform θ¹⁰. Which makes no sense since the first axis is indexed simultaneously by values of the three random variables. Meaning a particular index like 0.4 corresponds to three values of θ, namely θ=0.4 and θ²=0.4 and θ¹⁰=0.4… In other words, the “probability of event occurring, f(θ), corresponds to *three different* events and *three different* f’s. Another needless confusion is that the red and dashed density curves appeared as everywhere above one another, which is impossible since they both are probability densities. And the boxed legend does not help

 Cooked more stir-fries both away and at home, returning to Fall veggies like cabbages and gourds, along local mushrooms and fortunately had to get rid of a large lot of kimchi, making kimchi mandu and kimchi fried rice for the first time. And miso glazed eggplant (nasu degaku) after eating some in Eke, the local Japanese restaurant. Sample fares at the great South Melbourne market, from fabulous Tasmanian oysters [albeit generating their own weight in plastic containers!] to a decent kouign-amann and a disappointing cannolo! Bringing home local fruits and fiery birdseye chili peppers.


