Archive for mathematical puzzle

Round-robin (with Claude)

Posted in Books, Kids, R, Statistics, Wines with tags , , , , , , , , , , , , on August 15, 2026 by xi'an

A few days ago I had a coffee in Paris with my long-time friend (and former Statistics & Computing editor) Gilles Celeux, and he mentioned me stopping solving and posting maths puzzles like those weekly published by Le Monde. They have indeed vanished with the retirement of the authors, but Gilles added that the arrival of LLMs would have made the exercise moot. I disagreed as (i) the fun of solving the puzzle on my own  has not gone away and (ii) the pedagogical appeal of the puzzle and its resolution remains. As the next Fiddler puzzle arrived in my mailbox, my resolution was put to the test (contrariwise to the previous entry, which did not require massive computations):

The Fiddler League consists of two teams. Over a season, they play each other 162 times. Each team has an equal chance of winning each game, and the results of games are independent. Over the season, on average, how many games would you expect the team with the better record to have won?

I started on the wrong foot with E[X|X≥81] when X is Bin(162,½), equal to 85.77 (either directly or with a Normal approximation), which differs from my second thought, E[max(X,162-X)]=86.07 (either directly or with a Normal approximation), which is larger because of the reflection produced by max. While the first computation was manageable, the second one seemed to involve simulation and I caved in prompting Claude, which provided the answer along with the connection

E[max(X,162−X)]=E[X∣X≥81](1+p81​)−81p81​

After some expansion, the League boasts 30 teams. Over a season, each team plays each other team five times. (Each team plays a total of 145 games.) Again, each team has an equal chance of winning each game, and the results of games are independent. Over the season, on average, how many games would you expect the team with the best record to have won?

The best record is max(Xi) with each of the 30 Xi‘s a sum of 29 Yij and the Yij=5-Yji distributed as Bin(5,½). The Xi‘s are thus Bin (145,½) but dependent. While I could not figure out a closed form answer for the expectation, a direct Monte Carlo resolution is obviously feasible, with Claude (rather than me) running it over 400 million repetitions, but a 30 dimensional Normal approximation exploiting the correlation of 1/29 between the components leads to roughly 85 as the expected value. (Again computed by a Claudicant simulation.)

While the conclusion that the Normal approximation is pretty accurate with so many terms in the Binomial variates is quite unsurprising, Claude saves me coding time without ruining the puzzle altogether. (And Gemini made me aware that the name of the café where Gilles and I regularly meet, L’Écir, is an Auvergne noun for a local, dangerous, mountain blizzard! Thus linking the place to the foundation of the café by Auvergne expatriates…)

broken random generators

Posted in Statistics with tags , , , , , , on July 22, 2026 by xi'an

Nothing exciting or catastrophic here! Just a Friday afternoon puzzle entry on the successor to The Riddler (which I had not visited for a long while)… The first riddle reads as follows:

A random number generator on my calculator should generate random numbers between 0 and 1. But my suspicion is that the calculator is “tanked,” meaning it only generates random numbers between 0 and some value 0 < a < 1. Beyond that, I have no knowledge regarding the value of a. At the moment, it’s equally likely to be any value from 0 to 1. As an experiment, I ask the calculator to generate one random number. It produces a value of exactly 0.5. Based on this result, what can I expect the value of a to be, on average?

This is a direct (Bayesian) calculation of a posterior expectation when a given x=0.5 (a Uniform (0,a) realisation) is distributed as 1/(a log(2)) over (½,1), with expectation 1/(2 log(2)), about 0.72.

The added riddle just modifies the conditioning event (bringing it closer to Bayes experiment):

A second calculator is similarly “tanked.” As before, every value of a between 0 and 1 is equally likely at first. A friend generates one random number and only reveals that it’s somewhere between 0 and 0.5. On average, what can I expect the value of a to be?

This is also a direct (Bayesian) calculation with a Bernoulli output z, with probability min(0.5,a)/a, which results in a posterior expectation of a equal to 3/(4*(1+log(2))), about 0.44. And… I happened to get selected for my (correct) answer to this question!

more fiddlin [to the top]

Posted in Books, Kids with tags , , , on May 13, 2024 by xi'an

Each block in the pyramid above is the product of the two blocks below it, a, b, c, and d are distinct integers that are not perfect squares. What values for a, b, c, and d result in a integer top square value? What’s the smallest possible integer value for the top square?

Multiplying terms to the top of the pyramid return bc√(abcd), hence abcd must be a square x² with none of a,b,c,d being a square. If x=p¹p²p³p⁴ (with all terms distinct but not necessarily prime) and a=p¹p², b=p²p³,c=p³p⁴, and d=p⁴p¹, this works out, unless one of the terms a,b,c,d is a square. For instance, x=24=4x2x1x3 works, with a=8,b=2,c=3 and d=12, resulting in a top value of 6×24=144. Actually, the same applies to x=p¹p²p³ and a=p¹p², b=p¹,c=p³, and d=p²p³, with p²>max(p¹,p³). Then x=2x3x4=24 leads to a pyramid result of 2x3x24=144, which could be the smallest possible value.

joint fiddlin

Posted in Books, Kids, R, Statistics with tags , , , , , on April 22, 2024 by xi'an

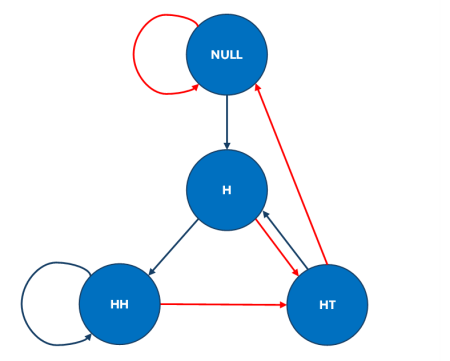
Flip a fair coin 100 times, resulting in a sequence of heads (H) and tails (T). For each HH in the sequence, Alice gets a point; for each HT, Bob does, so e.g. for the subsequence THHHT Alice gets 2 points and Bob gets 1 point. Who is most likely to win?

An interesting conundrum in that the joint distribution of (A,B) need be considered for showing that Bob is more likely. Indeed, looking at the marginals does not help since the probability of the base events is the same. A solution on X validated (for a question posted when the Fiddler’s puzzle came out, Friday morn) demonstrates via a four state Markov chain representation the result (obvious from a quick simulation) that Alice wins 45% of the time while Bob wins 48%. The intuition is that, each time Alice wins at least a point, Bob gets an extra point at the end of the sequence (except possibly at the stopping time t=100), while in other cases Alice and Bob have the same probability to win one point.

so long, and thanks for all the quests

Posted in Books, Kids, R with tags , , , , , , , , , on October 25, 2023 by xi'an

The Riddler, which I have followed for many years, has been discontinued by FiveThirtyEight, but its producer, Zach Wissner-Gross, has launched a personal website to keep considering a weekly mathematical puzzle. The Fiddler on the Proof! Expect thus more ‘Og entries in this category!