Archive for pie-chart
inside Africa [cover]
Posted in Books, pictures, Statistics, Travel with tags Africa, AI, art for science, Asilomar conference centre, bacterial genomes, Burkina Faso, cover, genomics, Ghana, guts, Kenya, microbiome, Nature, pie-chart, rogue universities, South Africa, Zulu baskets on April 25, 2025 by xi'an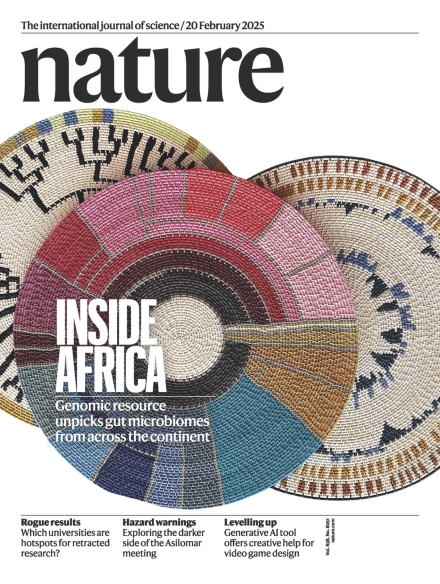
UK riot statistics
Posted in Statistics with tags pie-chart, riots, United Kingdom on August 19, 2011 by xi'an The Guardian published today some statistics related to the riots in England last week. The data is available, made of a dozen variables characterising those “people accused of offences related to this week’s riots“, along with plain pie-charts of binary variables (!). I am not sure how much can be said about this data, even though it will eventually cover over 2,000 people. A more interesting item of information would be sociological variables associated with the suspected rioters, as well as the dynamics that brought them to the riot places. The above map does little to explain whether or not the rioters were locals.


