Julien pointed out to me that the ‘Og was #2 in this list of “40 fascinating blogs for the ultimate statistics geek“… Dunno how to take it! I also note Statisfaction ranked as #4 and Freakanometrics as #5, which sounds like the ranking is a wee haphazard, the latter blog having at least four times as much trafffic as the ‘Og and focussing solely on statistics, acturial science, R programming, and related scientific questions! (Still, verrry nice to make it to a list!)
Archive for R-bloggers
#2 blog for the statistics geek?!
Posted in Uncategorized with tags blogging, Freakonometrics, geek, R-bloggers, Statisfaction, Statistics on January 24, 2011 by xi'anAsher’s enigma
Posted in R, Statistics with tags beta distribution, puzzle, R-bloggers, unit square on July 26, 2010 by xi'anOn his Probability and statistics blog, Matt Asher put a funny question (with my rephrasing):
Take a unit square. Now pick two spots at random along the perimeter, uniformly. For each of these two locations, pick another random point from one of the three other sides of the square and draw the segment. What is the probability the two segments intersect? And what is the distribution for the intersection points?
The (my) intuition for the first question was 1/2, but a quick computation led to another answer. The key to the computation is to distinguish whether or not both segments share one side of the square. They do with probability
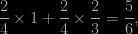
in which case they intersect with probability 1/2. They occupy the four sides with probability 1/6, in which case they intersect with probability 1/3. So the final answer is 17/36 (as posted by several readers and empirically found by Matt). The second question is much more tricky: the histogram of the distribution of the coordinates is peaked towards the boundaries, thus reminding me of an arc-sine distribution, but there is a bump in the middle as well. Computing the coordinates of the intersection depending on the respective positions of the endpoints of both segments and simulating those distributions led me to histograms that looked either like beta B(a,a) distributions, or like beta B(1,a) distributions, or like beta B(a,1) distributions… Not exactly, though. So not even a mixture of beta distributions is enough to explain the distribution of the intersection points… For instance, the intersection points corresponding to segments were both segments start from the same side and end up in the opposite side are distributed as

where all u‘s are uniform on (0,1) and under the constraint 
 The R code is
u=matrix(runif(4*10^5),ncol=4)
u[,c(1,3)]=t(apply(u[,c(1,3)],1,sort))
u[,c(2,4)]=-t(apply(-u[,c(2,4)],1,sort))
y=(u[,1]*(u[,4]-u[,3])-u[,3]*(u[,2]-u[,1]))/(u[,1]+u[,4]-u[,2]-u[,3])
Similarly, if the two segments start from the same side but end up on different sides, the distribution of one coordinate is given by

under the constraint 
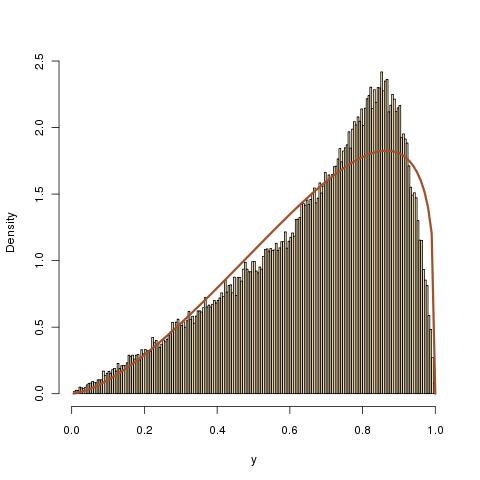 The corresponding R code is
u=matrix(runif(4*10^5),ncol=4)
u[,c(1,3)]=-t(apply(-u[,c(1,3)],1,sort))
y=(u[,1]*(1-u[,3])-u[,3]*u[,4]*(u[,2]-u[,1]))/(1-u[,3]-u[,4]*(u[,2]-u[,1]))
A quantum leap (CoRe in CiRM [4])
Posted in Books, R, University life with tags Bayesian Core, CIRM, ggplot2, hardy heron, lip cancer, mapvariable, R, R version 2.11.1, R-bloggers, Scotland, SpatialEpi, Ubuntu 9.10 on July 13, 2010 by xi'an Today, as I was trying to install SpatialEpi to use the Scotland lip cancer data in
  the last chapter of Bayesian Core, I realised my version of R, R Version 2.6.1, was hopelessly out of date! As I am also using Hardy Heron, a somehow antiquated version of Ubuntu on my Mac, upgrading R took some effort as well. I eventually found that adding the line
deb http://cran.cict.fr/bin/linux/ubuntu hardy/
in /etc/apt/sources.list worked nicely. So I now moved two years forward in time!!! On top is my first attempt at plotting the dataset with my modified version of mapvariable. As it happens, another blog appeared today on R-bloggers about color gradients using ggplot2.

A repulsive random walk
Posted in R, Statistics with tags Markov chain, R-bloggers, random walk, recurrence, transience on May 28, 2010 by xi'anMatt Asher posted an R experiment on R-bloggers yesterday simulating the random walk

which has the property of avoiding zero by quickly switching to a large value as soon as 
I reran the same experiment as Matt in a Monte Carlo perspective, using the R program
resu=matrix(0,ncol=100,nrow=25)
sampl=rnorm(100)
for (i in 1:25){
  for (t in 2^(i-1):2^i) sampl=sampl+rnorm(100)/sampl
     resu[i,]=sampl
     }
boxplot(as.data.frame(t(abs(resu))),name=as.character(1:25),col="wheat3")
 The outcome of this R code plotted above shows that the range and the average of the 100 replications is increasing with t. This behaviour indicates a transient behaviour of the Markov chain, which almost surely goes to infinity and never comes back (because at infinity the variance is zero). Another indication for transience is shown by the fact that

which is thus bounded from below by a null recurrent process, which almost surely goes to infinity. Therefore the above Markov chain cannot have a stationary distribution or even a stationary measure: it almost surely goes to (plus or minus) infinity.
Joining R-bloggers
Posted in Books, R, Statistics with tags R, R-bloggers, solution manual, typos on February 19, 2010 by xi'anUpon request by the blog administrator, Tal Galili, I have joined R-bloggers, which aggregate blog entries about R into a central place. I feel I have much more to learn than to teach about R (as can be seen from earlier comments on my R programs in Introducing Monte Carlo Methods with R). As I was tagging some of my older posts with the newly created R category, I realised most tags were either about typos or books! Anyway, I figure joining a conglomerate of blogs cannot hurt!


